Joy Evatt
Data Analyst and Editor
I love digging into data and pulling out the stories hidden inside.
Analyze
I have spent 15 years helping businesses make sense of their data. I've worked in risk management and with corporate veterinary groups, cleaning huge datasets and designing data models and dashboards that translate complex data into actionable insights.
Visualize
Alongside my work in data, I have a background in illustrated book publishing, overseeing illustrations, infographics, and page design. This comes through in my data analytics - I want my data visualizations to be more than just functional; they should beintuitive, engaging, and great to look at.

Explore my recent projects to learn more about what I do.

Human Resources Power BI Dashboard
I designed these customizable dashboard templates with sample data to provide Human Resources executives and business owners with essential insights into data such as active employees, attrition, employee demographics, department distribution, and years of service. Buy my dashboard templates on Etsy here: www.etsy.com/shop/LittleForestDesignCo

Case Study: Customizing Journal Entry Logic for Vet Group
The goal of this project was to customize the logic for a corporate vet group's journal entry dashboard. This solution needed to account for their clinics' different methods of tracking sales tax and discounts - including both discounts tracked separately and those netted against revenue. The solution involved creating a dbt (Data Build Tool) model that transformed transaction data from multiple sources, aggregated it, and generated a custom journal entry based on the specific conditions.
Portfolio

Custom Discounting Dashboard for Corporate Vet Group
I developed this dashboard for a corporate vet group. The client wanted to track discounts using their own logic, rather than the standardized discounts from our ETL pipeline. To align with their calculations, I recreated their Excel-based discount formulas using custom DAX measures. The final dashboard allowed the client to analyze discounts and leverage the data to optimize strategies.

Freelance Editor for Big Ideas Simply Explained (DK Books)
I worked as an editor for several books in the award-winning Big Ideas series from DK Books, collaborating with graphic designers and authors to plan engaging content. I helped to plan and design infographics, collaborate on page layouts, and sourced images. I also provided professional copy editing services, following the editorial style guide, refining grammar and clarity.


Contributing Writer for The Very Hungry Caterpillar's Very First Encyclopedia
I have written sections for highly illustrated DK books, including The Very Hungry Caterpillar's Very First Encyclopedia, The LGBTQ History Book, and The Black History Book. I was the author for approximately 30 spreads in this book. My writing allows me to share my passion for making complex topics accessible to a broad audience.
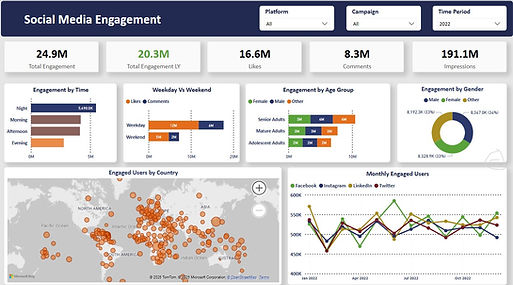
Social Media Power BI Dashboard
I designed this customizable Power BI template for executives in need of high-level social media analytic metrics at a glance. They include custom columns and measures in DAX. The report helps users track engagement metrics (likes, shares, comments), follower growth trends, best-performing posts, and platform-wise performance (Facebook, Instagram, LinkedIn, etc.). Buy my dashboard templates on Etsy here: www.etsy.com/shop/LittleForestDesignCo

Custom Client Balances (Accounts Receivable) Report for Corporate Vet Group

Case Study: Managing the Migration of Data Warehousing from Redshift to Snowflake Cloud
As the project manager for a client's cloud data migration, I led the transition from Amazon Redshift to Snowflake to improve performance, scalability, and cost efficiency. I structured the migration into manageable phases, coordinated the work of two colleagues, and ensured seamless integration with existing Power BI reporting.
I developed a custom client balances report for a large vet group, automating its delivery in emailed reports via KNIME. I created a custom data model in dbt, ensuring that the balance aging aligned with the client's expectations. A key challenge was also investigating a bucket aging discrepancy at two vet clinics and diagnosing possible causes, such as practice-specific data extraction times.
Get in Touch
Joy Evatt
Data Analyst and Editor
Based on Vancouver Island, BC


-
SQL
-
DAX
-
Power BI
-
Excel
-
Visual Studio Code
-
Snowflake Cloud
-
GitHub
-
Project Management
-
Client Customer Service
-
Data Cleaning
-
Data Analytics
-
Process Improvements
-
Group Staff Training
-
1-1 Mentoring